Process Infographics
It’s hard to describe some process just using words, but it’s much easier with infographics.
What you can create using Icograms Designer
Process infographics (also known as Workflow, Process Description Diagram, Flowchart, or How it Works) describe and visualise the way a certain process flows. By using a process infographic you explain how many, in what sequence, and what kind of steps should be taken in a particular process with the help of visual elements.
Process infographics could be created in Icograms Desginer to be used for visualisation of
- Workflow - instructions for your employees or users
- "How it Works" - documentation about your product
- Supply Chain - information about flow of goods and information
- Construction Phases
- Supply Chain
How to work with Icograms Designer
Get started from scratch
- Open Icograms Designer
- Drag and drop icons to work area
- Use clone tools and copy/paste to speed up
- Move, resize and recolor to find the best solution
- Add text and symbols
- Upload your own graphics if needed
- Download created graphics
Get started from template
- Choose a Template suitable for you
- Drag and drop additional graphics if needed
- Insert your own data using text boxes
- Change colors, fonts and icons to customize your design
- Upload your own graphics if needed
- Download created graphics
Process Infographics related Templates
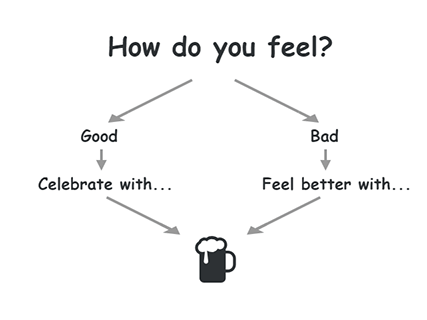
International Beer Day
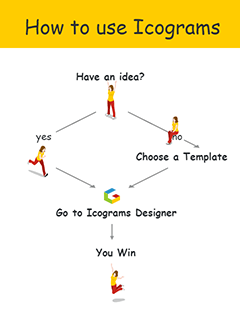
How to use Icograms
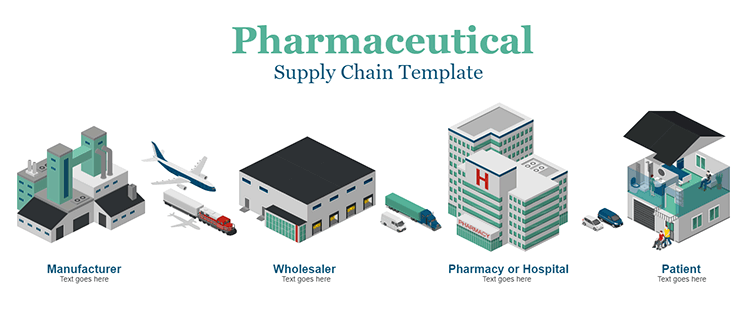
Pharmaceutical Supply Chain

Farm To Table
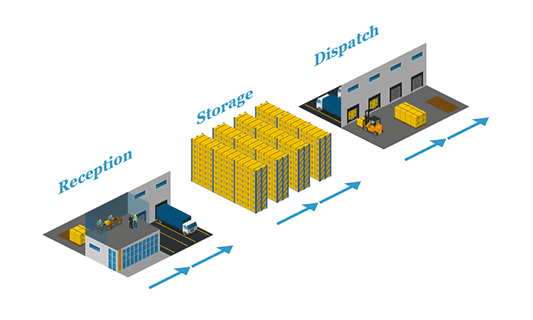
Warehouse Management
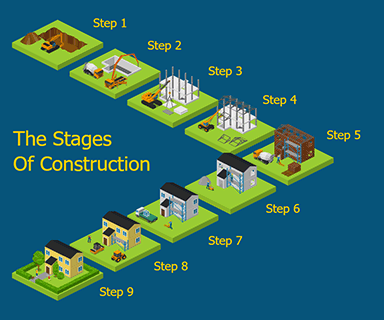
Construction Stages

Taxi Service Workflow Diagram

Multimodal Transportation Modes

Start start-up

Food Production Chain

Food Supply Chain