Process Visualization
It’s hard to describe some process just using words, but it’s much easier with graphics.
What you can create using Icograms Designer
***** DELETE THIS PAGE *****
You may visualize any process in Icograms Designer, for your presentation, report or site. It will allow other people better understand what's going on, what steps are performed, inputs and output of each step.
This may be used for visualising
- Workflow - instructions for your employees or users
- "How it Works" - documentation about your product
- Supply Chain - information about flow of goods and information
- Construction Phases
How to work with Icograms Designer
Get started from scratch
- Open Icograms Designer
- Drag and drop icons to work area
- Use clone tools and copy/paste to speed up
- Move, resize and recolor to find the best solution
- Add text and symbols
- Upload your own graphics if needed
- Download created graphics
Get started from template
- Choose a Template suitable for you
- Drag and drop additional graphics if needed
- Insert your own data using text boxes
- Change colors, fonts and icons to customize your design
- Upload your own graphics if needed
- Download created graphics
Process Visualization related Templates

Water Cycle Diagram

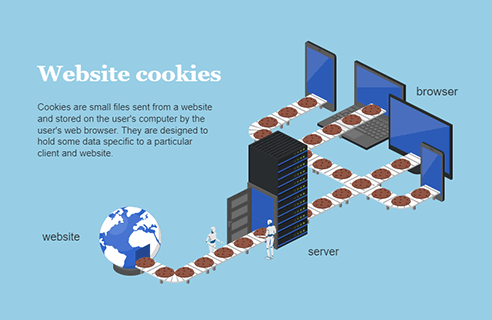
Website cookies

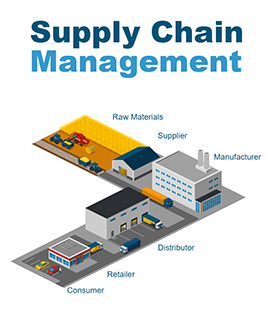
Supply Chain Management

Supply Chain Diagram

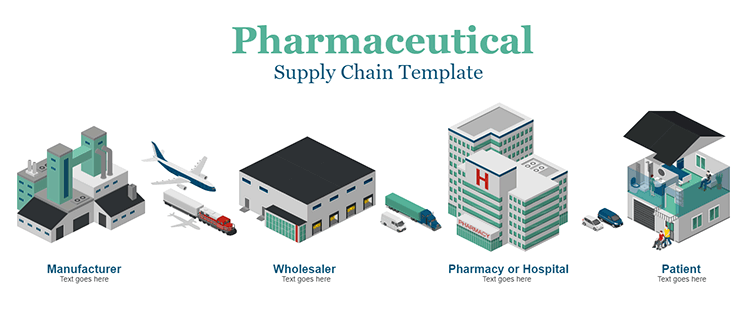
Pharmaceutical Supply Chain

Farm To Table

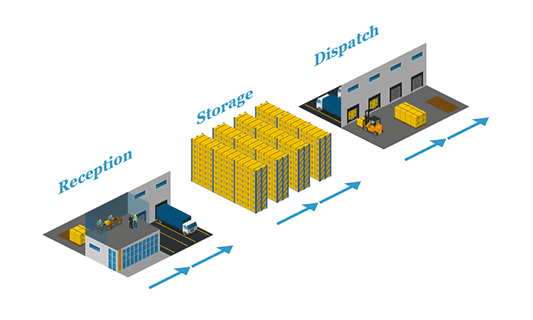
Warehouse Management

Road Construction

Construction Stages

Start start-up

Food Production Chain

Food Supply Chain