Chart Infographics
Create unique chart infographics using docking graphic blocks
What you can create using Icograms Designer
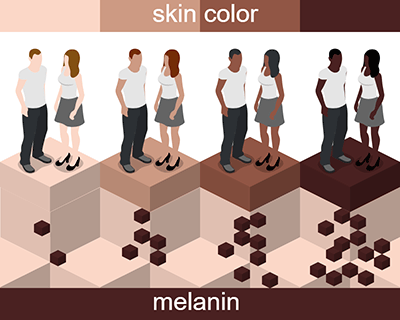
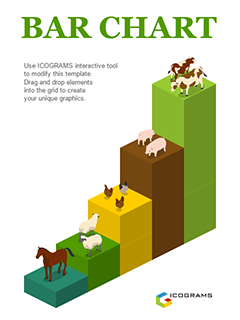
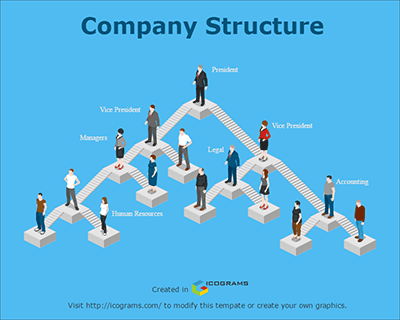
Adding charts to infographics allow to visualize your data in a more convenient way. Combining them with 3d looking icons will make your infographics appealing to users.
How to work with Icograms Designer
Get started from scratch
- Open Icograms Designer
- Drag and drop icons to work area
- Use clone tools and copy/paste to speed up
- Move, resize and recolor to find the best solution
- Add text and symbols
- Upload your own graphics if needed
- Download created graphics
Get started from template
- Choose a Template suitable for you
- Drag and drop additional graphics if needed
- Insert your own data using text boxes
- Change colors, fonts and icons to customize your design
- Upload your own graphics if needed
- Download created graphics
