Informational Infographics
How to represent a ton of information in an interesting way?
Informational Infographics is а good way to represent only the most important information.

What you can create using Icograms Designer
An informational infographic is composed mostly of text and lists and doesn’t rely as much on charts.
The information is typically enchanced with attractive color scheme and icons, to help visualise information.
How to work with Icograms Designer
Get started from scratch
- Open Icograms Designer
- Drag and drop icons to work area
- Use clone tools and copy/paste to speed up
- Move, resize and recolor to find the best solution
- Add text and symbols
- Upload your own graphics if needed
- Download created graphics
Get started from template
- Choose a Template suitable for you
- Drag and drop additional graphics if needed
- Insert your own data using text boxes
- Change colors, fonts and icons to customize your design
- Upload your own graphics if needed
- Download created graphics
Informational Infographics related Templates

Water Cycle Diagram

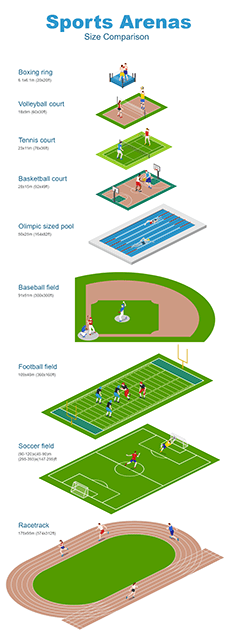
Sports Arenas Infographics

Start start-up

Stay at Home

Smart Home Technologies

World Population

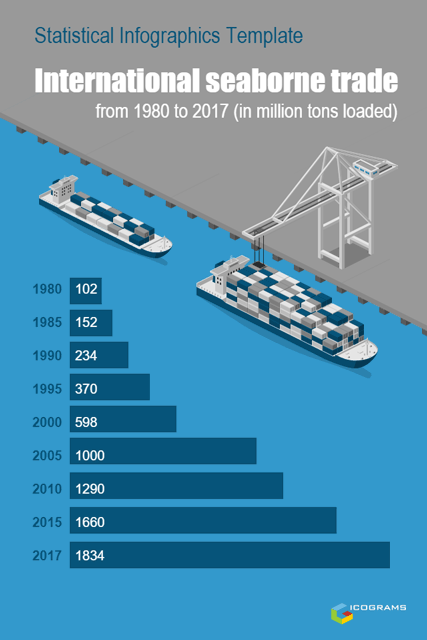
International seaborne trade

Most Congested Cities

Multimodal Transportation Modes

Computer Network Types

Antonov An-225 Mriya