Statistical Infographics
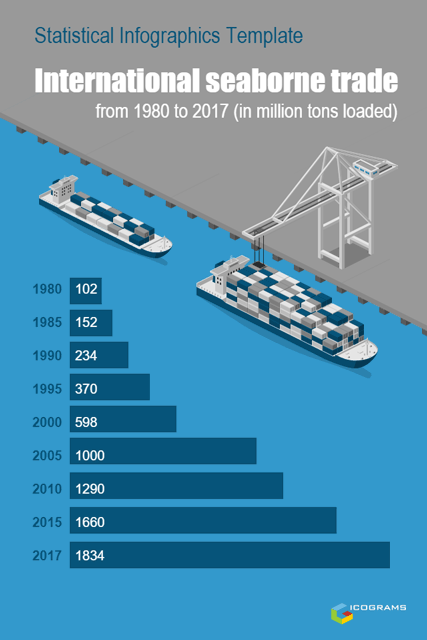
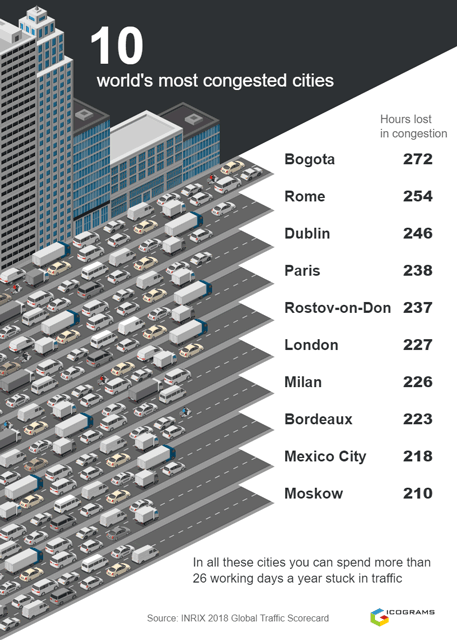
Statistical infographics are based on data,
but good graphics can make it more visual.

What you can create using Icograms Designer
A statistical infographic is a type of infographic that tells the story behind your data.
It's the base choice to represent survey data, official and government data, data from different sources, etc.
Additionally it can include charts, icons, images and nice fonts.
How to work with Icograms Designer
Get started from scratch
- Open Icograms Designer
- Drag and drop icons to work area
- Use clone tools and copy/paste to speed up
- Move, resize and recolor to find the best solution
- Add text and symbols
- Upload your own graphics if needed
- Download created graphics
Get started from template
- Choose a Template suitable for you
- Drag and drop additional graphics if needed
- Insert your own data using text boxes
- Change colors, fonts and icons to customize your design
- Upload your own graphics if needed
- Download created graphics


